ipyrad-analysis toolkit: sharing
Calculate and plot pairwise locus sharing and pairwise missigness
[3]:
%load_ext autoreload
%autoreload 2
%matplotlib inline
The autoreload extension is already loaded. To reload it, use:
  %reload_ext autoreload
required software
This analysis tool requires the seaborn module for the heatmap plotting. toyplot also has a matrix function for plotting heatmaps, but I found that it grinds on assemblies with many taxa.
[1]:
# conda isntall -c conda-forge seaborn
[171]:
import ipyrad
import ipyrad.analysis as ipa
from ipyrad.analysis.sharing import Sharing
[5]:
# the path to your VCF or HDF5 formatted snps file
data = "/home/isaac/ipyrad/test-data/pedicularis/analysis-ipyrad/ped_outfiles/ped.snps.hdf5"
[167]:
imap = {
    "prz": ["32082_przewalskii_SRR1754729", "33588_przewalskii_SRR1754727"],
    "cys": ["41478_cyathophylloides_SRR1754722", "41954_cyathophylloides_SRR1754721"],
    "cya": ["30686_cyathophylla_SRR1754730"],
    "sup": ["29154_superba_SRR1754715"],
    "cup": ["33413_thamno_SRR1754728"],
    "tha": ["30556_thamno_SRR1754720"],
    "rck": ["35236_rex_SRR1754731"],
    "rex": ["35855_rex_SRR1754726", "40578_rex_SRR1754724"],
    "lip": ["39618_rex_SRR1754723", "38362_rex_SRR1754725"],
}
[29]:
# load the snp data into sharing tool with arguments
from ipyrad.analysis.sharing import Sharing
share = Sharing(
    data=data,
    imap=imap,
)
share.run()
[30]:
share.sharing_matrix
[30]:
| 29154_superba_SRR1754715 | 30556_thamno_SRR1754720 | 30686_cyathophylla_SRR1754730 | 32082_przewalskii_SRR1754729 | 33413_thamno_SRR1754728 | 33588_przewalskii_SRR1754727 | 35236_rex_SRR1754731 | 35855_rex_SRR1754726 | 38362_rex_SRR1754725 | 39618_rex_SRR1754723 | 40578_rex_SRR1754724 | 41478_cyathophylloides_SRR1754722 | 41954_cyathophylloides_SRR1754721 | |
|---|---|---|---|---|---|---|---|---|---|---|---|---|---|
| 29154_superba_SRR1754715 | 0.0 | 23403.0 | 23403.0 | 17719.0 | 23403.0 | 20378.0 | 23403.0 | 22557.0 | 23123.0 | 20495.0 | 22859.0 | 23317.0 | 22001.0 |
| 30556_thamno_SRR1754720 | 0.0 | 0.0 | 23403.0 | 17719.0 | 23403.0 | 20378.0 | 23403.0 | 22557.0 | 23123.0 | 20495.0 | 22859.0 | 23317.0 | 22001.0 |
| 30686_cyathophylla_SRR1754730 | 0.0 | 0.0 | 0.0 | 17719.0 | 23403.0 | 20378.0 | 23403.0 | 22557.0 | 23123.0 | 20495.0 | 22859.0 | 23317.0 | 22001.0 |
| 32082_przewalskii_SRR1754729 | 0.0 | 0.0 | 0.0 | 0.0 | 17719.0 | 14694.0 | 17719.0 | 17127.0 | 17522.0 | 15554.0 | 17314.0 | 17655.0 | 16676.0 |
| 33413_thamno_SRR1754728 | 0.0 | 0.0 | 0.0 | 0.0 | 0.0 | 20378.0 | 23403.0 | 22557.0 | 23123.0 | 20495.0 | 22859.0 | 23317.0 | 22001.0 |
| 33588_przewalskii_SRR1754727 | 0.0 | 0.0 | 0.0 | 0.0 | 0.0 | 0.0 | 20378.0 | 19666.0 | 20115.0 | 17893.0 | 19895.0 | 20315.0 | 19216.0 |
| 35236_rex_SRR1754731 | 0.0 | 0.0 | 0.0 | 0.0 | 0.0 | 0.0 | 0.0 | 22557.0 | 23123.0 | 20495.0 | 22859.0 | 23317.0 | 22001.0 |
| 35855_rex_SRR1754726 | 0.0 | 0.0 | 0.0 | 254.0 | 0.0 | 134.0 | 0.0 | 0.0 | 22284.0 | 19758.0 | 22013.0 | 22475.0 | 21232.0 |
| 38362_rex_SRR1754725 | 0.0 | 0.0 | 0.0 | 83.0 | 0.0 | 17.0 | 0.0 | 7.0 | 0.0 | 20215.0 | 22597.0 | 23038.0 | 21730.0 |
| 39618_rex_SRR1754723 | 0.0 | 0.0 | 0.0 | 743.0 | 0.0 | 423.0 | 0.0 | 109.0 | 0.0 | 0.0 | 20053.0 | 20424.0 | 19418.0 |
| 40578_rex_SRR1754724 | 0.0 | 0.0 | 0.0 | 139.0 | 0.0 | 61.0 | 0.0 | 0.0 | 18.0 | 102.0 | 0.0 | 22774.0 | 21505.0 |
| 41478_cyathophylloides_SRR1754722 | 0.0 | 0.0 | 0.0 | 22.0 | 0.0 | 23.0 | 0.0 | 4.0 | 1.0 | 15.0 | 1.0 | 0.0 | 21915.0 |
| 41954_cyathophylloides_SRR1754721 | 0.0 | 0.0 | 0.0 | 359.0 | 0.0 | 240.0 | 0.0 | 77.0 | 9.0 | 325.0 | 48.0 | 0.0 | 0.0 |
[72]:
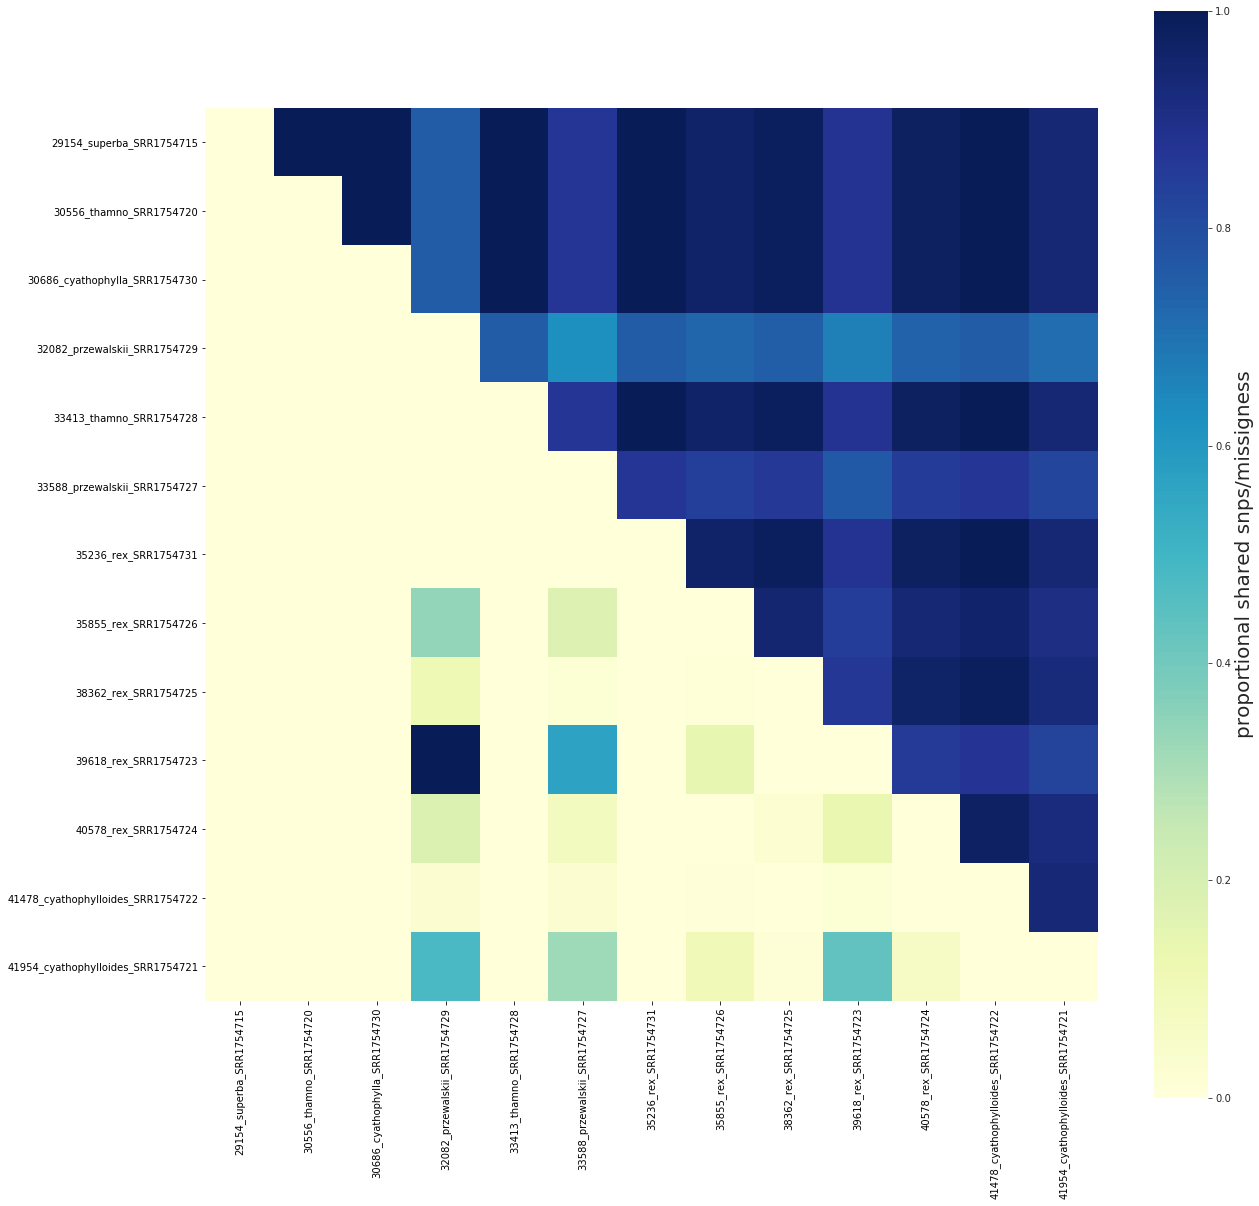
## Plot shared snps/missigness as proportions scaled to max values
fig, ax = share.draw()
[73]:
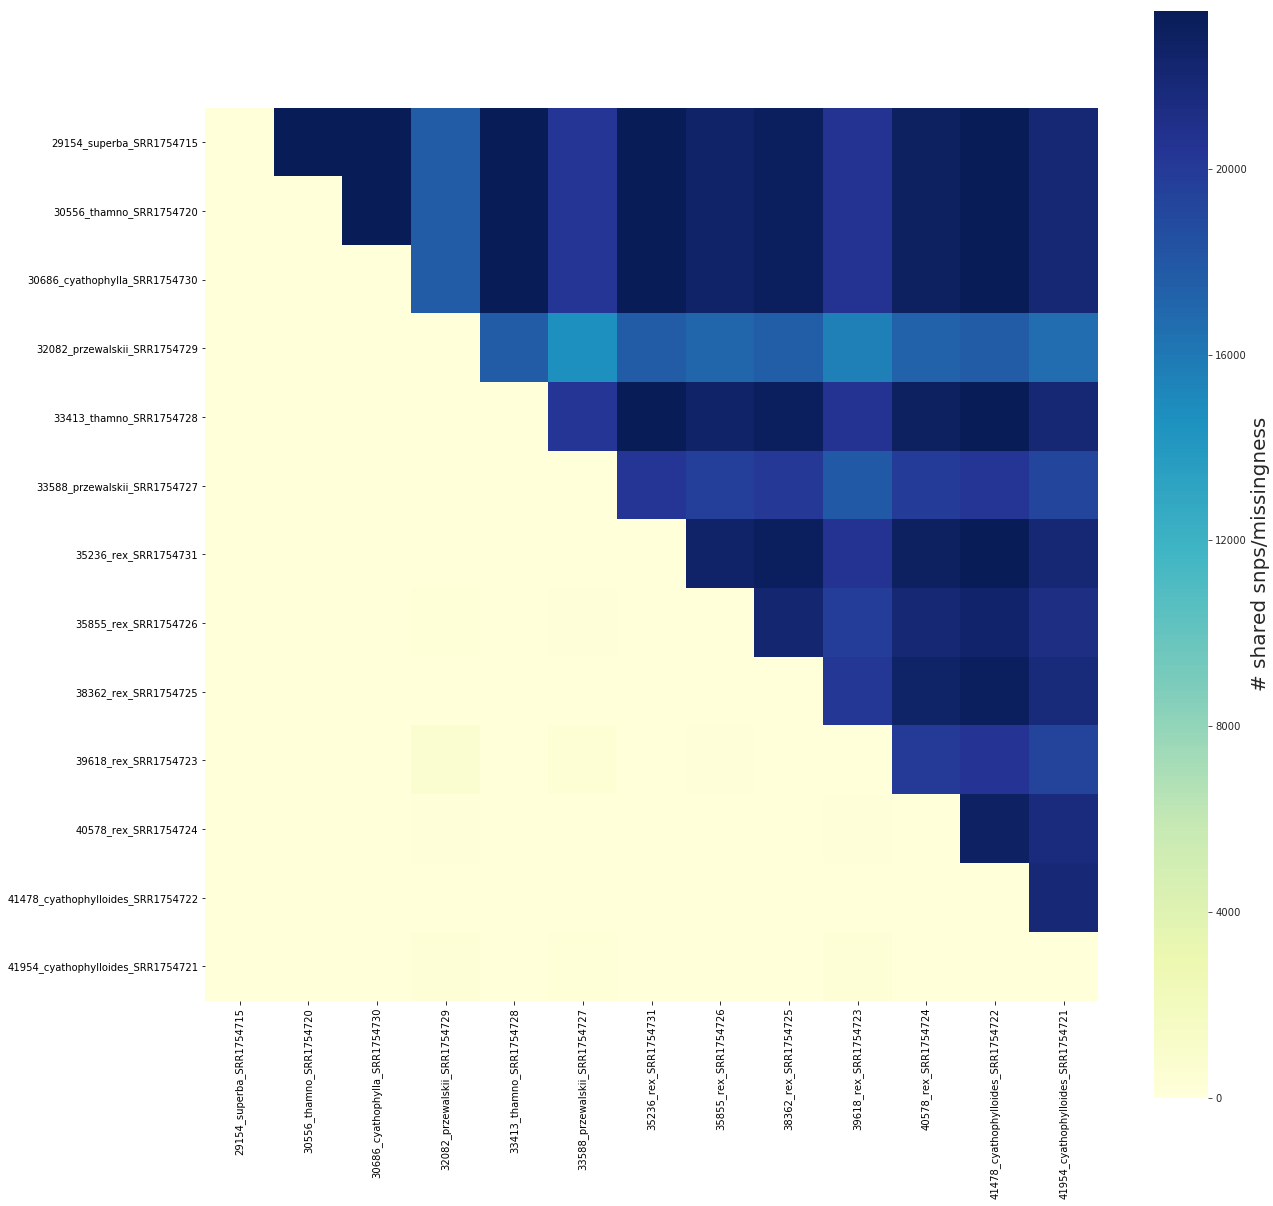
## Plot shared snps/missigness as raw values
fig, ax = share.draw(scaled=False)
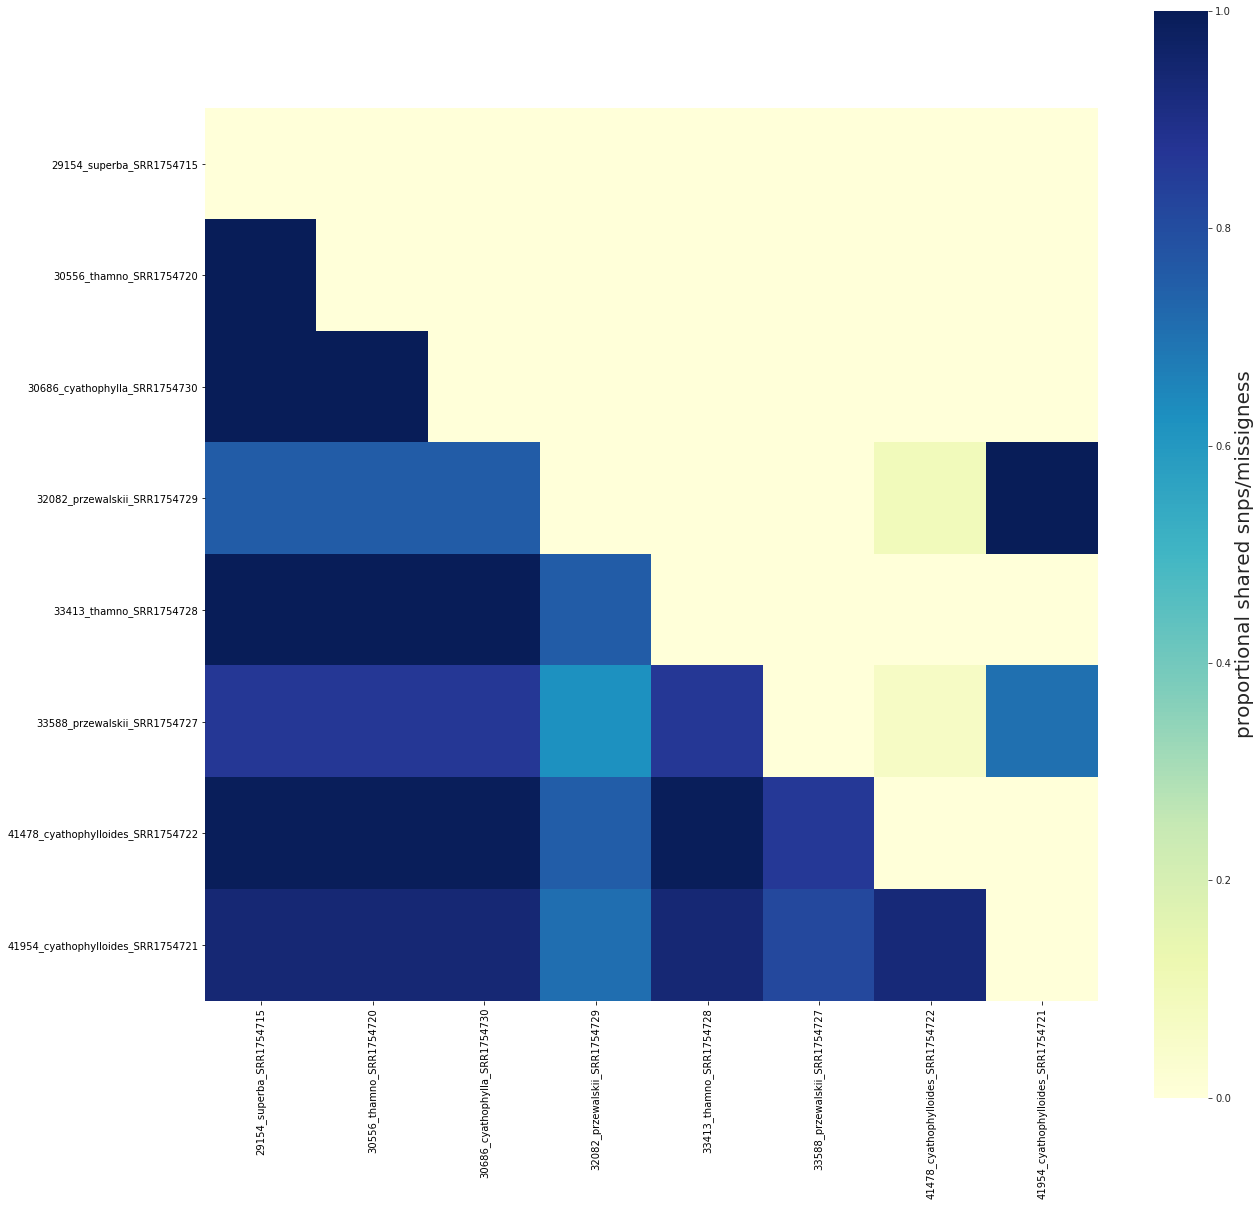
Removing samples from the sharing matrix is as simple as removing them from the imap
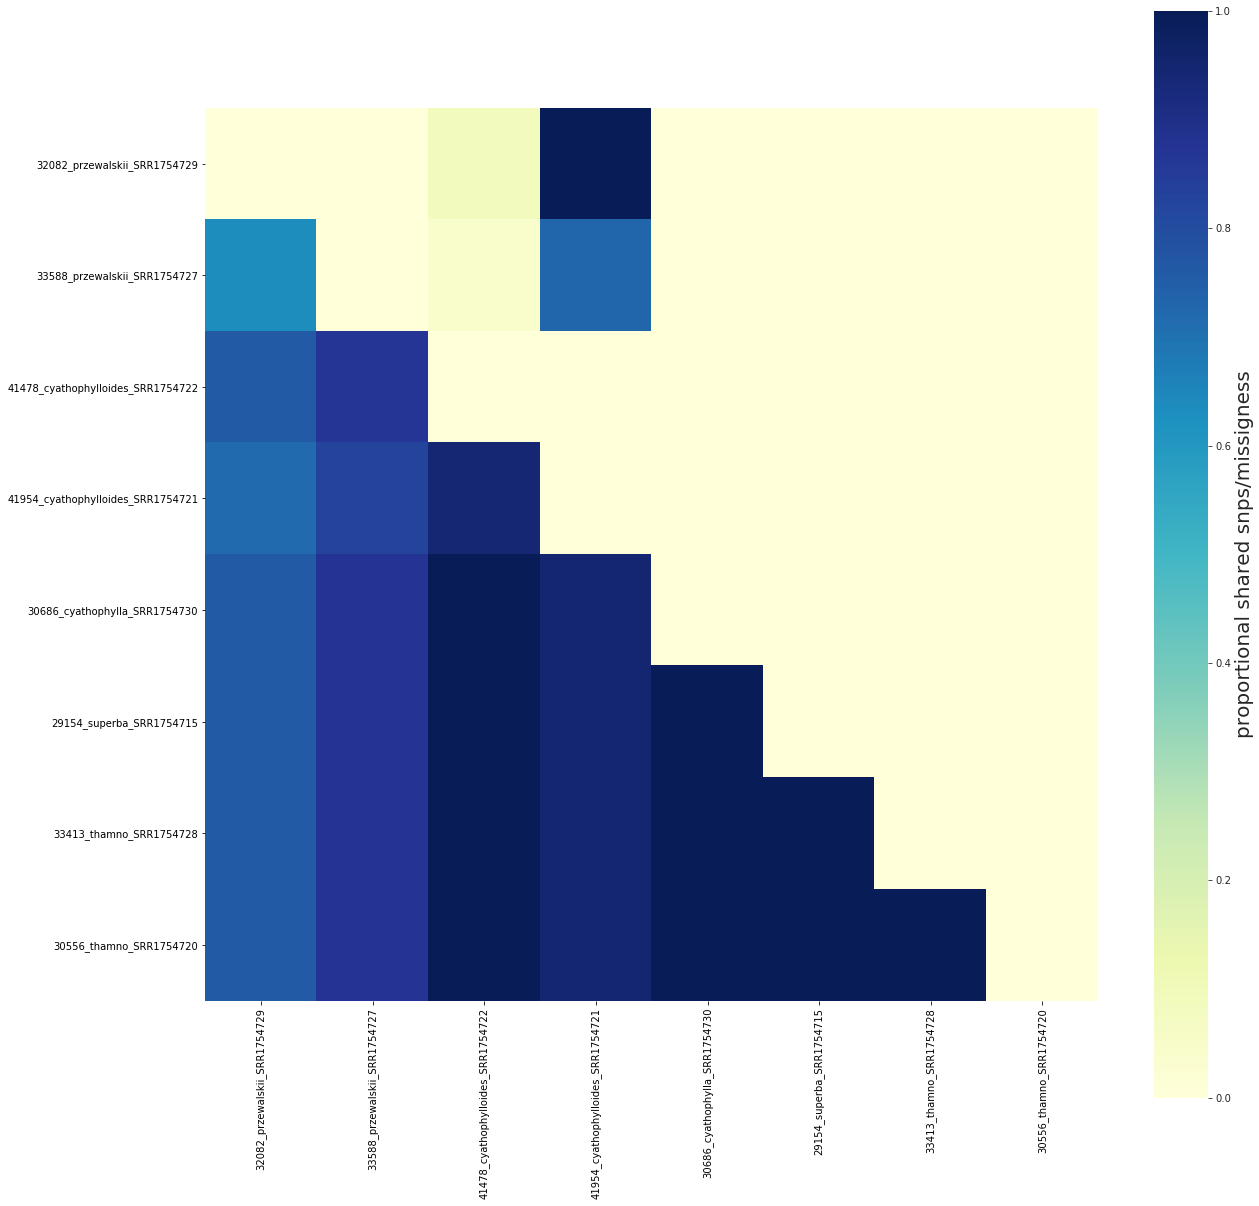
This can be a convenience for speeding up the pairwise calculations if you have lots of samples and only want to examine a few of them.
[157]:
imap = {
    "prz": ["32082_przewalskii_SRR1754729", "33588_przewalskii_SRR1754727"],
    "cys": ["41478_cyathophylloides_SRR1754722", "41954_cyathophylloides_SRR1754721"],
    "cya": ["30686_cyathophylla_SRR1754730"],
    "sup": ["29154_superba_SRR1754715"],
    "cup": ["33413_thamno_SRR1754728"],
    "tha": ["30556_thamno_SRR1754720"],
#    "rck": ["35236_rex_SRR1754731"],
#    "rex": ["35855_rex_SRR1754726", "40578_rex_SRR1754724"],
#    "lip": ["39618_rex_SRR1754723", "38362_rex_SRR1754725"],
}
# load the snp data into sharing tool with arguments
share = Sharing(
    data=data,
    imap=imap,
)
share.run()
fig, ax = share.draw()
[####################] 100% 0:00:00 | Calculating shared loci/missingness
[ ]:
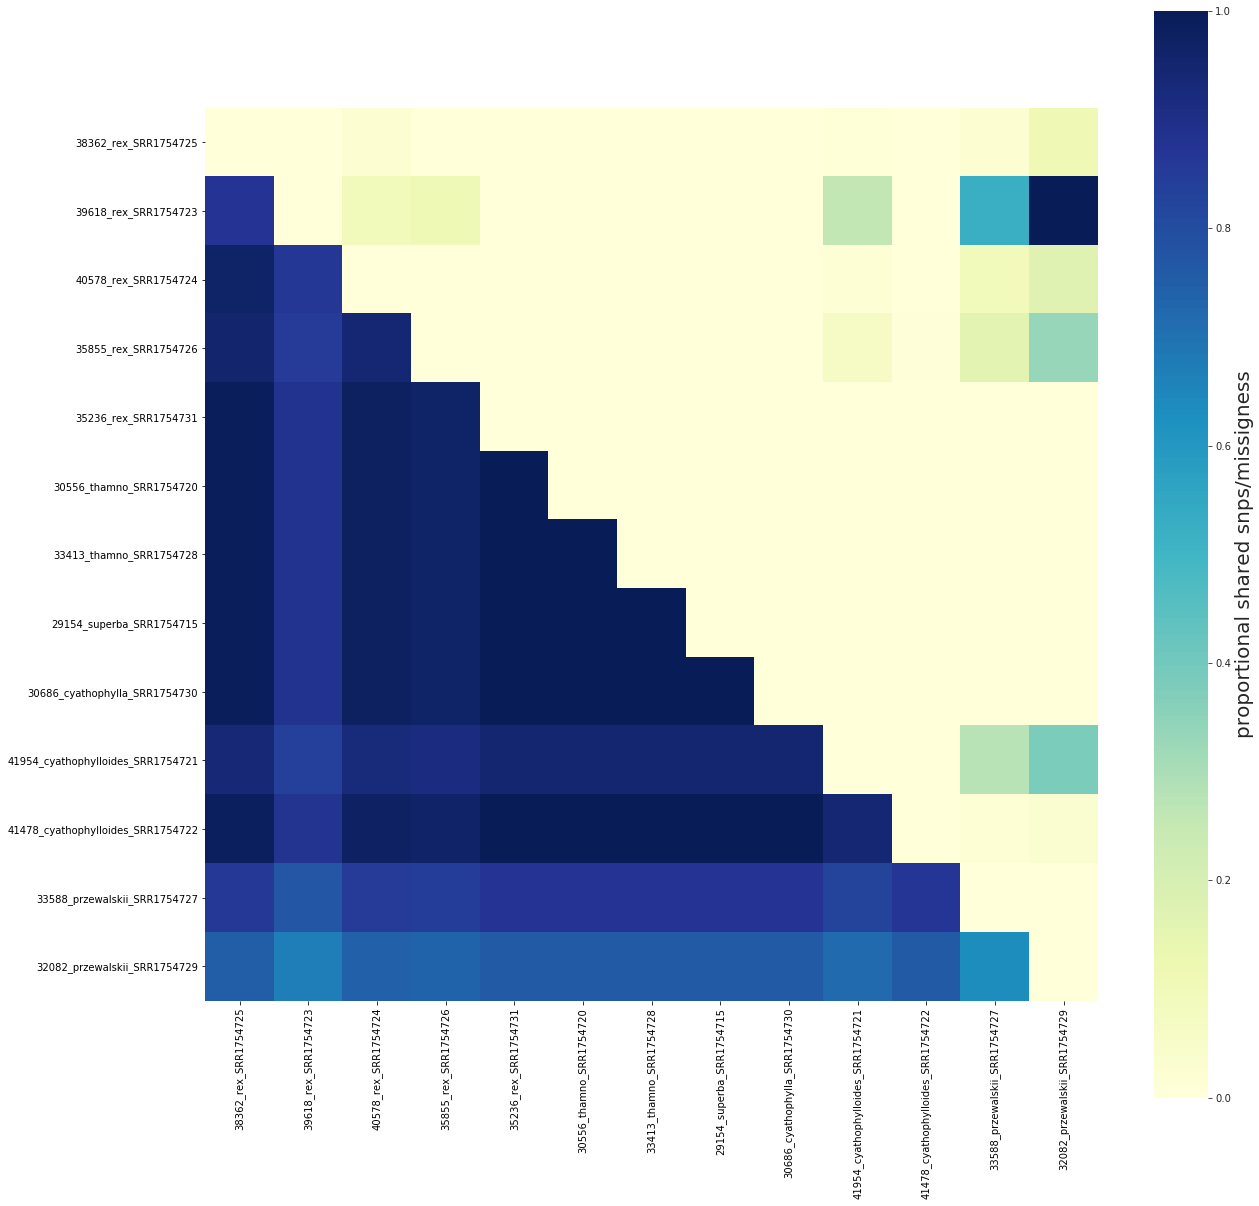
The order of samples in the figure can be reconfigured with the keep_order argument
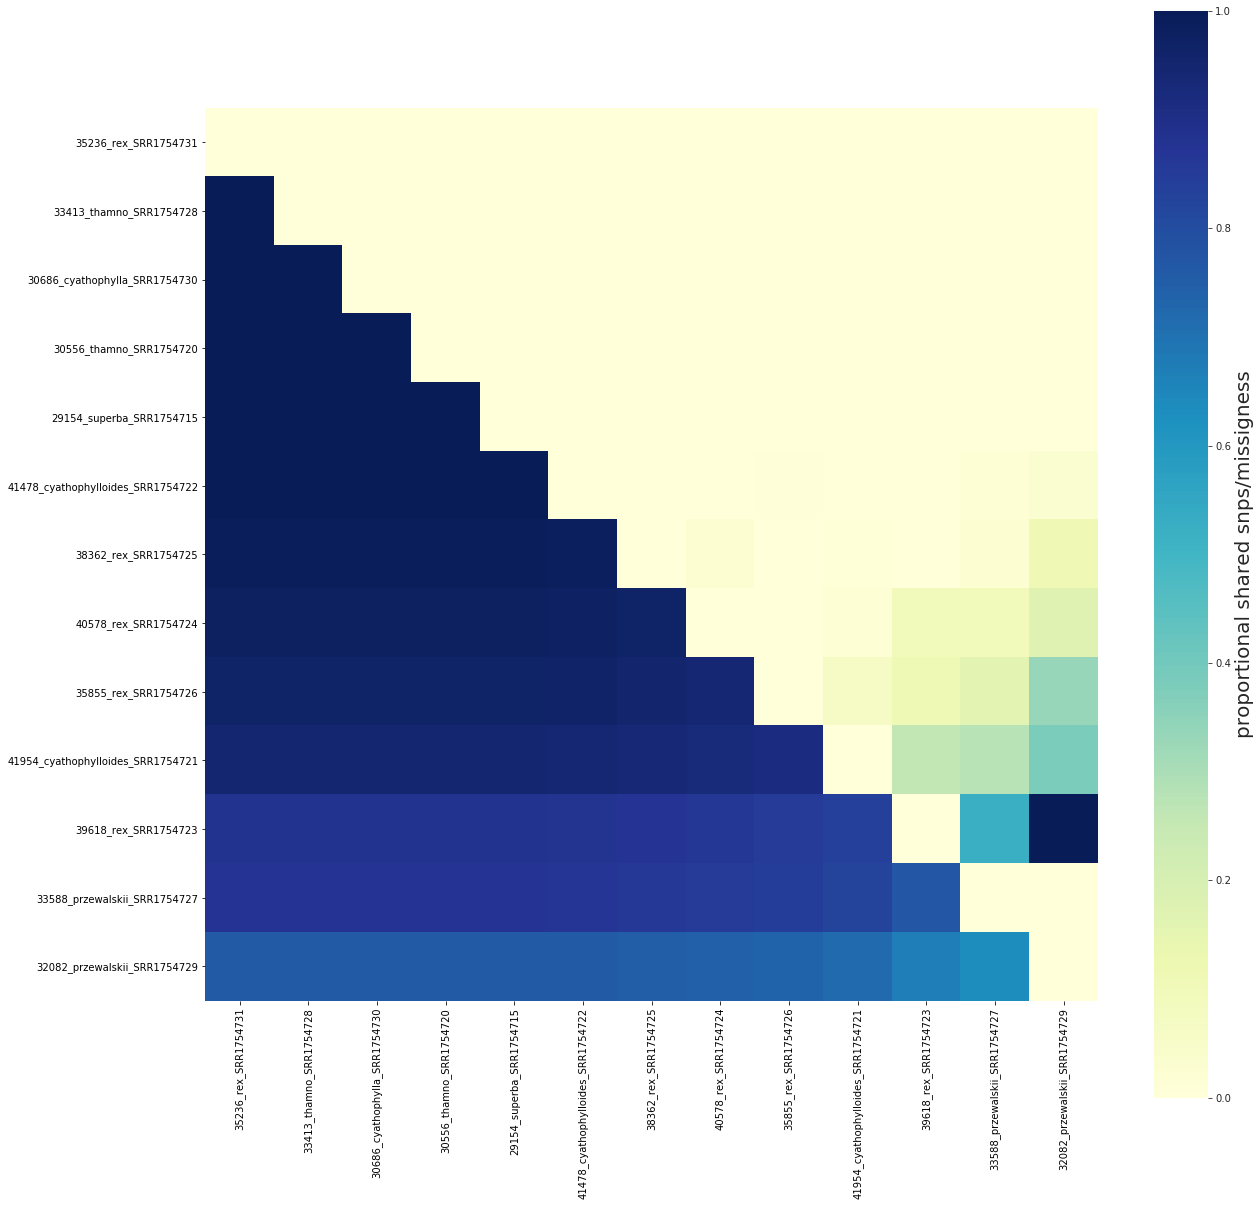
This allows for flexibly reordering samples in the figure without recalculating the sharing values. This parameter will accept a list or a dictionary, and will only plot the specified samples in list order.
[168]:
imap = {
    "prz": ["32082_przewalskii_SRR1754729", "33588_przewalskii_SRR1754727"],
    "cys": ["41478_cyathophylloides_SRR1754722", "41954_cyathophylloides_SRR1754721"],
    "cya": ["30686_cyathophylla_SRR1754730"],
    "sup": ["29154_superba_SRR1754715"],
    "cup": ["33413_thamno_SRR1754728"],
    "tha": ["30556_thamno_SRR1754720"],
    "rck": ["35236_rex_SRR1754731"],
    "rex": ["35855_rex_SRR1754726", "40578_rex_SRR1754724"],
    "lip": ["39618_rex_SRR1754723", "38362_rex_SRR1754725"],
}

# Hack to get a list of samples in some order
order = sum(imap.values(), [])[::-1]
print(order)

share = Sharing(
    data=data,
    imap=imap,
    mincov=0.83,
)
share.run()
fig, ax = share.draw(keep_order=order)
['38362_rex_SRR1754725', '39618_rex_SRR1754723', '40578_rex_SRR1754724', '35855_rex_SRR1754726', '35236_rex_SRR1754731', '30556_thamno_SRR1754720', '33413_thamno_SRR1754728', '29154_superba_SRR1754715', '30686_cyathophylla_SRR1754730', '41954_cyathophylloides_SRR1754721', '41478_cyathophylloides_SRR1754722', '33588_przewalskii_SRR1754727', '32082_przewalskii_SRR1754729']
[####################] 100% 0:00:00 | Calculating shared loci/missingness
An example of using keep_order to plot a subset of the imap samples
[170]:
imap2 = {
    "prz": ["32082_przewalskii_SRR1754729", "33588_przewalskii_SRR1754727"],
    "cys": ["41478_cyathophylloides_SRR1754722", "41954_cyathophylloides_SRR1754721"],
    "cya": ["30686_cyathophylla_SRR1754730"],
    "sup": ["29154_superba_SRR1754715"],
    "cup": ["33413_thamno_SRR1754728"],
    "tha": ["30556_thamno_SRR1754720"],
#    "rck": ["35236_rex_SRR1754731"],
#    "rex": ["35855_rex_SRR1754726", "40578_rex_SRR1754724"],
#    "lip": ["39618_rex_SRR1754723", "38362_rex_SRR1754725"],
}
_, _ = share.draw(keep_order=imap2)
